How Do I Read My Solar Production Numbers?
So, you've taken the leap into solar energy, and your shiny new panels are up on the roof, soaking in the sun. That's fantastic! But then comes the moment you log into your monitoring app or check your utility bill, and you're staring at a bunch of numbers and graphs: kWh, kW, daily production, export, import. It can feel like deciphering a secret code, and honestly, it's totally normal to feel a bit overwhelmed. You're not alone if you've ever wondered, "What in the world do these solar production numbers actually mean for my home and my savings?" This guide is here to walk you through exactly how to read and understand your solar production data, turning that confusion into confidence.
Understanding Your Solar Monitoring System
When you invest in solar, you're not just getting panels; you're getting a sophisticated system designed to convert sunlight into usable electricity and then track every bit of it. Understanding the tools at your disposal is the first step to becoming a solar pro in your own home.
How Solar Monitoring Works
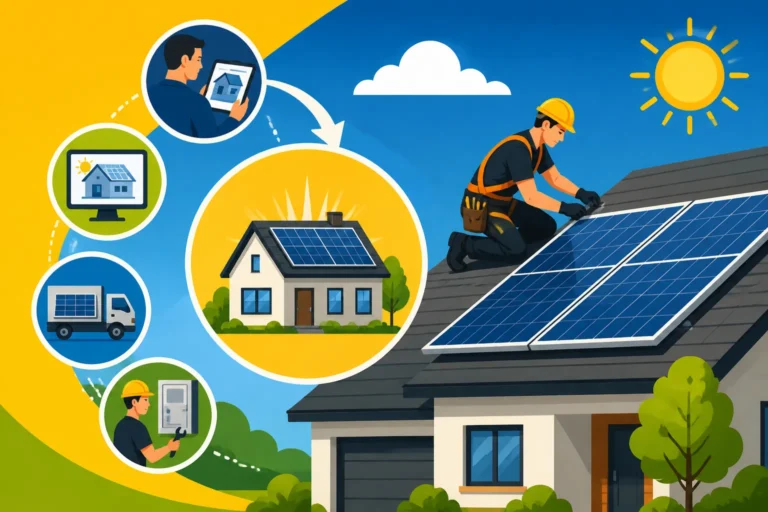
At its heart, your solar monitoring system is a network of sensors and software that keeps an eye on your solar panels' performance. Every solar panel system includes an inverter (or microinverters if you have those), which is the brain converting the direct current (DC) electricity from your panels into the alternating current (AC) electricity your home uses. These inverters are constantly collecting data on how much power each panel, or the entire array, is producing. This raw data — like the energy output at any given moment and the total energy produced over time — is then sent to a central hub, usually via your home's Wi-Fi network.
From there, this data is uploaded to a cloud-based platform provided by your inverter manufacturer. Think of brands like Enphase with their Enlighten app, or SolarEdge with their Monitoring Platform. These platforms process the data, turn it into easy-to-read graphs and charts, and make it accessible to you through a web portal or a mobile app on your phone. This means you can check your system's pulse from anywhere, whether you're at home or on vacation. This continuous flow of information is crucial not just for you to see your savings, but also for your installer and even your utility to ensure everything is running smoothly. For instance, if you used a service like Modernize to find your installer, they would likely have set up this monitoring from day one, so you're never left in the dark about your system's performance.
Key Metrics You'll See
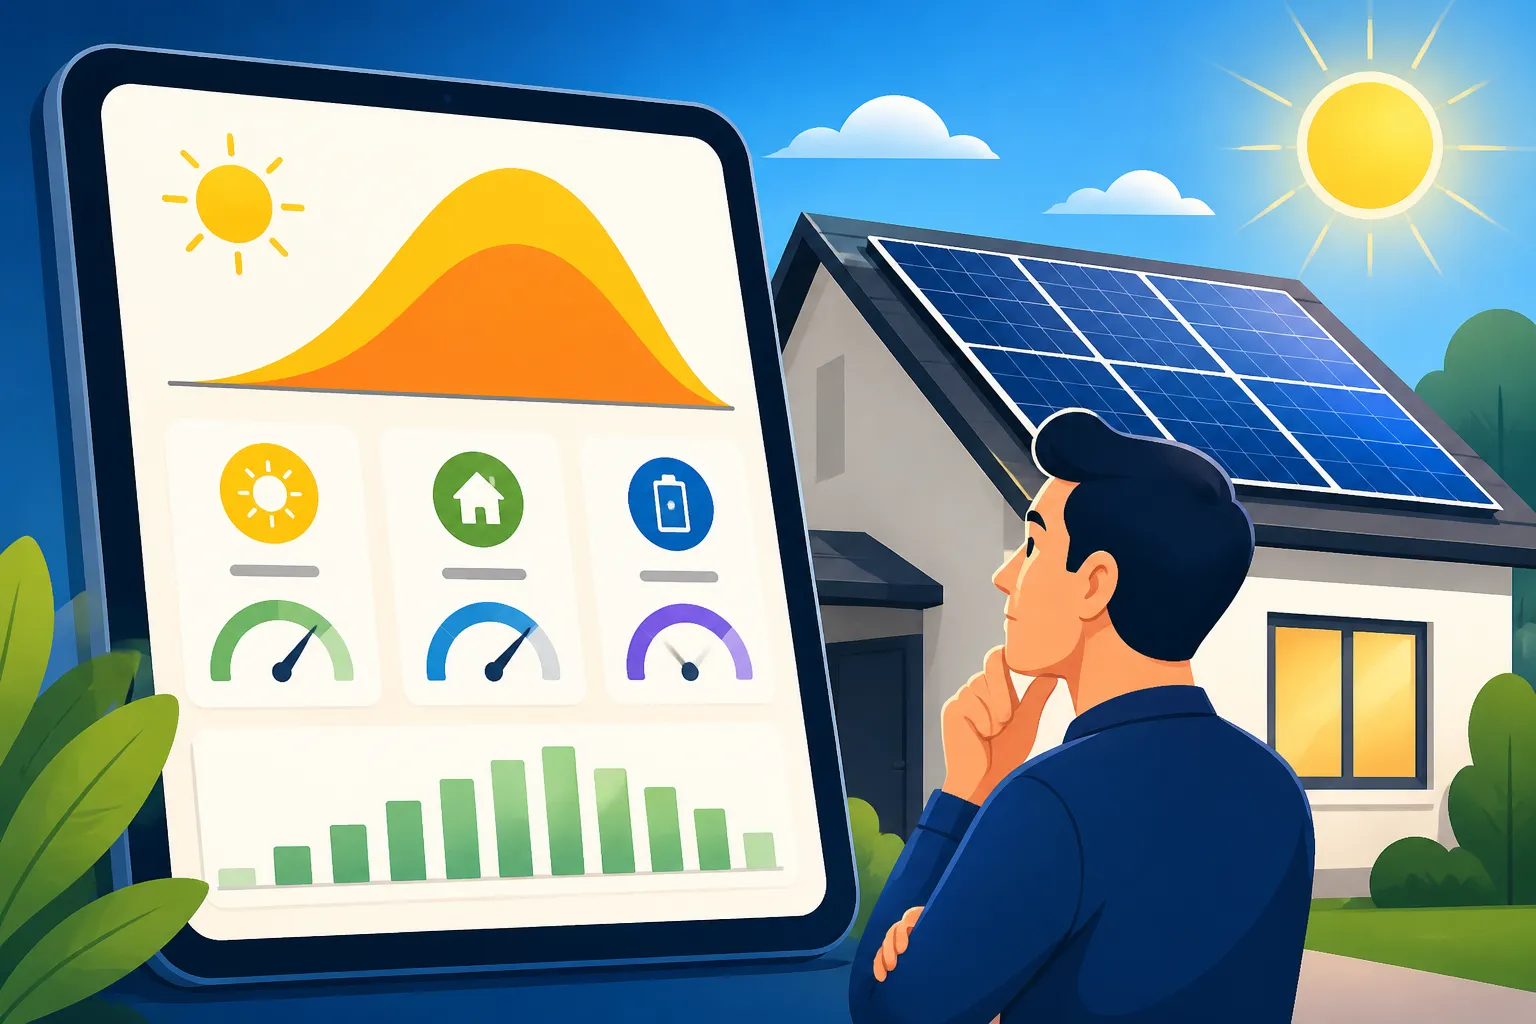
Once you're logged into your monitoring platform, you'll encounter a few core metrics that are essential for understanding your system's performance. The most important one, and often the most confusing for newcomers, is kilowatt-hours (kWh). This measures the total amount of electricity produced over a specific period, much like how your utility bill measures your consumption. You'll also frequently see kilowatts (kW), which represents the rate at which your system is producing power at any given moment. It’s like the difference between how much gas your car consumed on a trip (kWh) versus how fast you were going at a particular moment (kW).
Beyond these core units, your monitoring dashboard will typically show you daily, weekly, monthly, and annual production totals. Many systems also provide insights into your home's energy consumption, especially if you have a smart meter or additional consumption monitoring installed. This allows you to compare what your panels are generating against what your home is actually using. Some advanced systems even track metrics like carbon emissions avoided, which can be a fun way to visualize your environmental impact. Regularly checking these numbers helps you build an intuitive understanding of your system's rhythm and how it responds to different conditions.
Accessing Your Data
The beauty of modern solar systems is the ease of access to your production data. Most homeowners will primarily use a dedicated mobile app or a web portal provided by their inverter manufacturer. As mentioned, Enphase users will be familiar with the Enlighten app, which offers a comprehensive view of individual panel performance, while SolarEdge users will use their monitoring platform for similar insights. These interfaces are typically user-friendly, designed to present complex data in an intuitive way with color-coded graphs and clear summaries.
In addition to your inverter manufacturer's platform, your local utility company might also provide access to your energy data through their online portal. This is especially true if you have a smart meter that tracks both your electricity consumption and the electricity your solar panels export back to the grid. While the utility's data might be slightly delayed compared to your real-time inverter app, it's often the most accurate reflection of what you'll be billed for (or credited for, thanks to net metering). It's a good idea to familiarize yourself with both your inverter's app and your utility's portal to get a complete picture. Sometimes, third-party apps or home energy management systems can also integrate with your solar data, offering even more ways to visualize and manage your energy flow. Knowing What Happens After Solar Is Installed? means understanding how to use these tools effectively.
Decoding Common Solar Production Numbers
Now that we know where to find the data, let's dive into what those specific numbers actually mean. This is where many homeowners get tripped up, but with a little explanation, it'll all click into place.
Kilowatt-Hours kWh vs. Kilowatts kW
This is arguably the most fundamental distinction to grasp when looking at your solar production. Think of electricity like water flowing through a pipe. Kilowatts (kW) is the rate of flow at any given moment – it's the instantaneous power your system is generating. If your system is producing 5 kW, that means it's churning out 5,000 watts of power right then and there. This number will fluctuate throughout the day, peaking when the sun is brightest and directly hitting your panels, and dropping to zero at night.
Kilowatt-hours (kWh), on the other hand, represent the total volume of water that has flowed over a period of time. It's the cumulative energy produced. If your system produces 5 kW for one hour, that's 5 kWh of energy. If it produces 2.5 kW for two hours, that's also 5 kWh. Your utility bill charges you for kWh consumed, and your solar system produces kWh. So, when you look at your "daily production" number, you're seeing the total kWh your system generated from sunrise to sunset. Understanding this difference is key to calculating your true savings and knowing How Much Can You Save With Solar Panels? over time.
Daily, Monthly, and Annual Production
When you first go solar, you'll likely have an estimated annual production number in your proposal, perhaps stating that your system should generate around 10,000 kWh per year. This figure is a target, and your daily, monthly, and annual production numbers are how you track your progress against it. Your daily production will, understandably, vary wildly. A sunny summer day in Phoenix, Arizona, will yield significantly more kWh than a cloudy winter day in Seattle, Washington. You'll notice a clear seasonal pattern: higher production in the longer, sunnier months and lower production during shorter, cloudier periods.
Monthly totals smooth out these daily fluctuations, giving you a better sense of your system's performance trends. Comparing your current month's production to the same month last year (if you have historical data) can help identify if your system is performing as expected. Finally, the annual production figure is the most important for assessing your system's long-term performance and financial returns. It's this number that you'll compare against your home's total annual energy consumption to see how close you are to energy independence. Keep in mind that factors like Solar Panel Efficiency & Degradation Explained mean that these numbers might slightly decrease over decades, but good warranties account for that.
Export vs. Import: Understanding Net Metering
This is where things get really interesting, especially with programs like net metering. When your solar panels produce more electricity than your home is currently using, that excess power doesn't just disappear. Instead, it's "exported" back to the main utility grid. Your smart meter records this exported electricity. Conversely, when your home needs more power than your solar panels are producing (like at night, or on a very cloudy day when you're running all your appliances), you "import" electricity from the grid, just like you did before solar.
Net metering is the billing mechanism that allows you to get credit for the electricity you export. Essentially, your utility tracks both the power you pull from the grid (import) and the power you send back (export). At the end of the billing cycle, they "net out" these amounts. If you exported more than you imported, you might receive a credit on your bill. If you imported more, you'll pay for the difference. This system varies by state and utility, so understanding Net Metering Explained: How It Works by State is critical for maximizing your savings. Without net metering, or with less favorable "net billing" structures like California's NEM 3.0, having a solar battery becomes much more important for storing your excess production instead of exporting it for lower credit. Your monitoring system should clearly show you both your export and import figures, giving you a transparent view of your energy exchange with the grid.
| Metric | Unit | What it Represents | Why it Matters |
|---|---|---|---|
| Instantaneous Power | kW | The rate at which your system is producing electricity right now. | Shows real-time output, helps identify immediate issues like shading or temporary drops in production. |
| Total Energy Produced | kWh | The cumulative amount of electricity generated over a specific period (daily, monthly, annually). | This is your actual solar output, directly offsetting your electricity consumption and indicating your financial savings. |
| Home Consumption | kWh | The amount of electricity your home is using at any given time or over a period. | Allows you to compare your production to your usage, helping you understand self-consumption and grid reliance. |
| Export to Grid | kWh | Excess electricity your solar system sends back to the utility grid. | Under net metering, this earns you credits, reducing your overall bill. Essential for understanding your net energy balance. |
| Import from Grid | kWh | Electricity your home pulls from the utility grid when solar production is insufficient. | Shows your reliance on the grid, especially at night or during peak demand, and what you'll be billed for. |
What Influences Your Solar Production
It's easy to assume solar panels just magically make electricity, but their performance is a delicate dance between technology and the environment. Several factors play a significant role in how much energy your system actually produces.
Environmental Factors
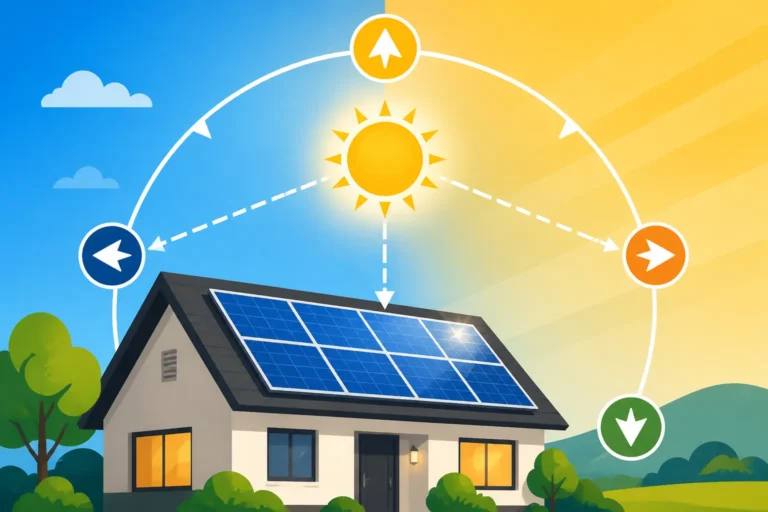
The most obvious influence on your solar production is, of course, the sun itself. More sunlight generally means more production. This is why you'll see your highest generation during the peak hours of a clear, sunny day, typically around midday when the sun is highest in the sky. Cloud cover, even light haziness, can significantly reduce output because fewer solar rays reach your panels. Heavy overcast days or storms can drop production to very low levels. It's not that your panels stop working in these conditions, but their efficiency is drastically reduced.
Shading is another critical factor. Even a small shadow from a nearby tree branch, a chimney, or a dormer can impact the performance of an entire string of panels, especially if you have an older string inverter system. This is where microinverters (like those from Enphase) or power optimizers (like SolarEdge) really shine, as they allow each panel to operate independently, mitigating the impact of partial shading. Even temperature plays a role; while panels need sunlight, they actually perform slightly less efficiently at very high temperatures. Think of it like electronics – they often work best within a certain temperature range. So, a perfectly sunny but extremely hot day in Arizona might see slightly lower peak efficiency than a sunny day with moderate temperatures.
System Health and Maintenance
Beyond the weather, the health of your actual solar equipment has a huge bearing on its production numbers. Regular Solar Panel Maintenance & Cleaning can make a noticeable difference. Dirt, dust, pollen, bird droppings, or even a build-up of leaves can create micro-shading and reduce the amount of sunlight hitting the solar cells. While rain often provides a natural cleaning, it's not always enough, especially in dusty or heavily polluted areas. A clean panel is a happy, productive panel!
Then there's the health of your inverters. As the crucial component that converts DC to AC, any malfunction here will directly impact your output. Modern inverters are highly reliable, but like any electronic device, they can fail or experience issues. Your monitoring system should alert you to inverter errors. Similarly, wiring connections, circuit breakers, and other electrical components all need to be functioning correctly. While panels themselves are incredibly durable, they do experience a slight degradation in efficiency over time, typically less than 1% per year. This is a normal part of their lifecycle, and reputable manufacturers like REC or Qcells provide performance warranties that account for this. It’s also why understanding How Long Do Solar Panels Last? is part of being an informed solar owner.
Comparing Actual to Expected Production
When you first got your solar proposal, your installer (perhaps one you found through a network like Modernize) provided you with an estimated annual production. This estimate is based on a lot of data: your roof's tilt and azimuth, local weather patterns, historical solar irradiance for your area, potential shading, and the specific equipment chosen. Once your system is up and running, you'll naturally want to compare your actual production numbers to those initial estimates.
It's important to remember that estimates are just that — estimates. There will always be some variability. A particularly cloudy year, or a year with unusual weather patterns, might result in production slightly below the estimate. Conversely, a sunnier-than-average year could see you exceed expectations. However, if your actual production is consistently and significantly lower than the estimate (say, 15-20% or more below, year after year), that's a red flag. This could indicate a persistent issue, like a shading problem that wasn't fully accounted for, a malfunctioning inverter, or panels not performing optimally. Many solar contracts include production guarantees or Performance-Based Incentives PBI Explained where the installer commits to a certain level of performance. Knowing your numbers helps you hold them accountable.
Troubleshooting Low or Unexpected Production
It's bound to happen eventually: you check your monitoring app and see a dip in production, or worse, no production at all! Don't panic. Many issues are easily diagnosable and fixable.
Common Issues and Initial Checks
Before you call your installer in a frenzy, there are a few simple things you can check. First, take a look at your inverter. Does it have any error codes displayed? Most inverters have small screens or indicator lights that can signal a problem. Sometimes, a simple power cycle (turning off the breaker to the inverter, waiting a few minutes, then turning it back on) can resolve minor glitches. Also, check your home's Wi-Fi connection. Since your monitoring system relies on Wi-Fi to send data to the cloud, a lost internet connection can make it appear as though your system isn't producing, when in reality, it's just not reporting. Your panels might still be working perfectly, but the data isn't reaching your app.
Next, do a visual inspection of your panels if it's safe to do so. Are they covered in debris, like leaves after a storm? Is there significant bird droppings? Is there any obvious physical damage? Even something as simple as a fallen branch can block a crucial part of your array. If you have microinverters, you can often see individual panel performance on your app, which can help pinpoint a specific panel that might be underperforming. These basic checks can save you the time and expense of an unnecessary service call.
When to Contact Your Installer or Utility
While some issues can be self-diagnosed, there are definitely times when it's best to call in the professionals. If you've done your initial checks and your system is still showing significantly low production, or no production at all, and there are no obvious external factors (like heavy snow cover), it's time to contact your solar installer. They have the tools and expertise to diagnose internal system faults, such as inverter malfunctions, wiring issues, or even problems with individual panels. Remember, your system typically comes with robust warranties, so many of these fixes will be covered. You want to ensure your system is performing optimally to get the full benefit of your investment, especially when considering Solar Panel Cost by System Size (kW) and the long-term savings.
You might also need to contact your utility company if you suspect an issue with your meter, or if there's a discrepancy between your inverter's reported production and what the utility is showing for your export/import. Sometimes, issues with Permission to Operate PTO Explained or communication between your system and the grid can arise, and the utility is the best resource for those specific grid-related problems. Documenting your production numbers, error codes, and the steps you've taken to troubleshoot will be incredibly helpful when you speak with either your installer or the utility.
Leveraging Data for Efficiency
The numbers your solar monitoring system provides aren't just for checking if things are working; they're powerful tools for optimizing your energy usage and maximizing your savings. By consistently tracking your daily production and comparing it to your home's consumption, you can start to identify patterns. For example, you might notice that on sunny afternoons, your panels are producing far more electricity than your home is currently using. This is a perfect opportunity to run high-energy appliances like your dishwasher, washing machine, or even charge an electric vehicle, using your own free solar power rather than pulling from the grid.
Many monitoring apps offer detailed insights into your energy profile, showing you when your consumption peaks and how much of that is covered by solar. This data empowers you to make smarter choices about when to use electricity, potentially shifting some usage to match your peak production hours. This strategy, known as "load shifting," is especially beneficial in states with less favorable net metering policies. Think of your monitoring data as a feedback loop, constantly informing you on how to become a more energy-efficient household. By paying attention to these numbers, you’re actively participating in your home's energy management. Learning How to Monitor Solar Panel Performance is a skill that truly pays off!
Disclaimer
Please remember that this article provides general information and guidance. Solar energy systems and incentives can vary significantly by location, utility company, and the specific equipment installed. Always consult with a qualified solar professional and your local utility provider for advice tailored to your specific situation. Tax credits and incentives are subject to change, and we recommend consulting with a tax professional for personalized financial advice.